Four circles of the app, everyone has it!
I started this research in 2017 and I have surveyed 1000+ users and interviewed quite a few to understand their app usage patterns, and their behaviours.

Today we are surrounded by apps, and our life depends on apps. Interestingly every app promises to solve the user’s problem and tries to add some form of ‘value’ to the user’s experience, but we still end up uninstalling apps. If every app solves something for the user, why do we uninstall it?
I used to have 276 apps on my phone, so I decided to count how many I needed. It turned out that I needed less than 10% of the apps. A few apps landed in my need bucket, and a few in want. But every app had its pattern of my usage. I was using some daily, a few weeks and a few apps a few times a month, and I am sure this might also be true for others. Lots of apps I used a few times, and a few I just kept on my phone or ended up uninstalling. Now, if I look at every app that tries to solve our problem, why do I end up uninstalling them? As the number of apps increases, many companies seem to be striving hard to catch up but are missing the underlying thought process.
A few questions I kept asking were:
“Why I’m not using 90%?”
“What’s wrong with them?”
“Why am I keep going back to 10%?”
276 vs 10% > Trigger
I decided to research ‘app usage patterns’ to understand “what it takes to design or build an app which people would like to keep on their phone and use it.”
Understand app usage patterns - qualitative
To begin with, I spoke to 8 friends in person to understand their app behaviours. I tried to understand:
Style of usage
Emotions
Motivations
Usage patterns
Types of apps they have on their phone
How often do they use
Why and when they uninstall the app
What kinds of apps do they use when the emotions are substantial, and why.
I gave each one an exercise
Count the total number of 3rd party apps you:
Have installed on your phone excluding system apps.
Use daily.
Use weekly, excluding daily apps.
Use monthly, excluding daily & weekly apps.
What motivates them to come back to the app?
What triggers to the installation of the app?
What’s the trigger for uninstalling?
Age group
These conversations gave me exciting insights. I noticed a pattern that the value of an app changes over time. Sometimes an app can become a need, and after the same time, the same app changes to a want.
I felt these insights weren’t enough, so I gathered more data about usage patterns and planned quantitative research to collect more data to validate.

Mobile apps are an integral part of a consumer’s overall digital experience and customer journey; in fact, 90% of all mobile time is taking place in mobile apps alone.”
Survey & exercise - quantitative
I planned a survey, and an exercise rolled out to around 1300+ people in two countries (India and Singapore). 289 people responded. It was essential for people to do the task, and then based on the exercise, they needed to fill out the survey. The survey included quantitative + qualitative questions. The survey questionnaire was made in such a way that it had quantitative and qualitative questions. Getting qualitative data is hard through a survey because of its remote nature, the time it takes, and one cannot adequately express their true motivations/emotions. Still, I wanted at least a few keywords that could provide profound insights.
Exercise:
Count the total number of 3rd party apps you have installed on your phone, excluding system apps.
Count the total number of 3rd party apps you use daily.
Count the total number of 3rd party apps you use weekly, excluding daily ones.
Count the total number of 3rd party apps you use monthly, excluding daily & weekly apps.
This exercise gave me the number. Next step was to understand these:
What motivates them to come back to the app.
What triggers to install the app?
What’s the trigger for uninstalling?
Age group
Survey findings
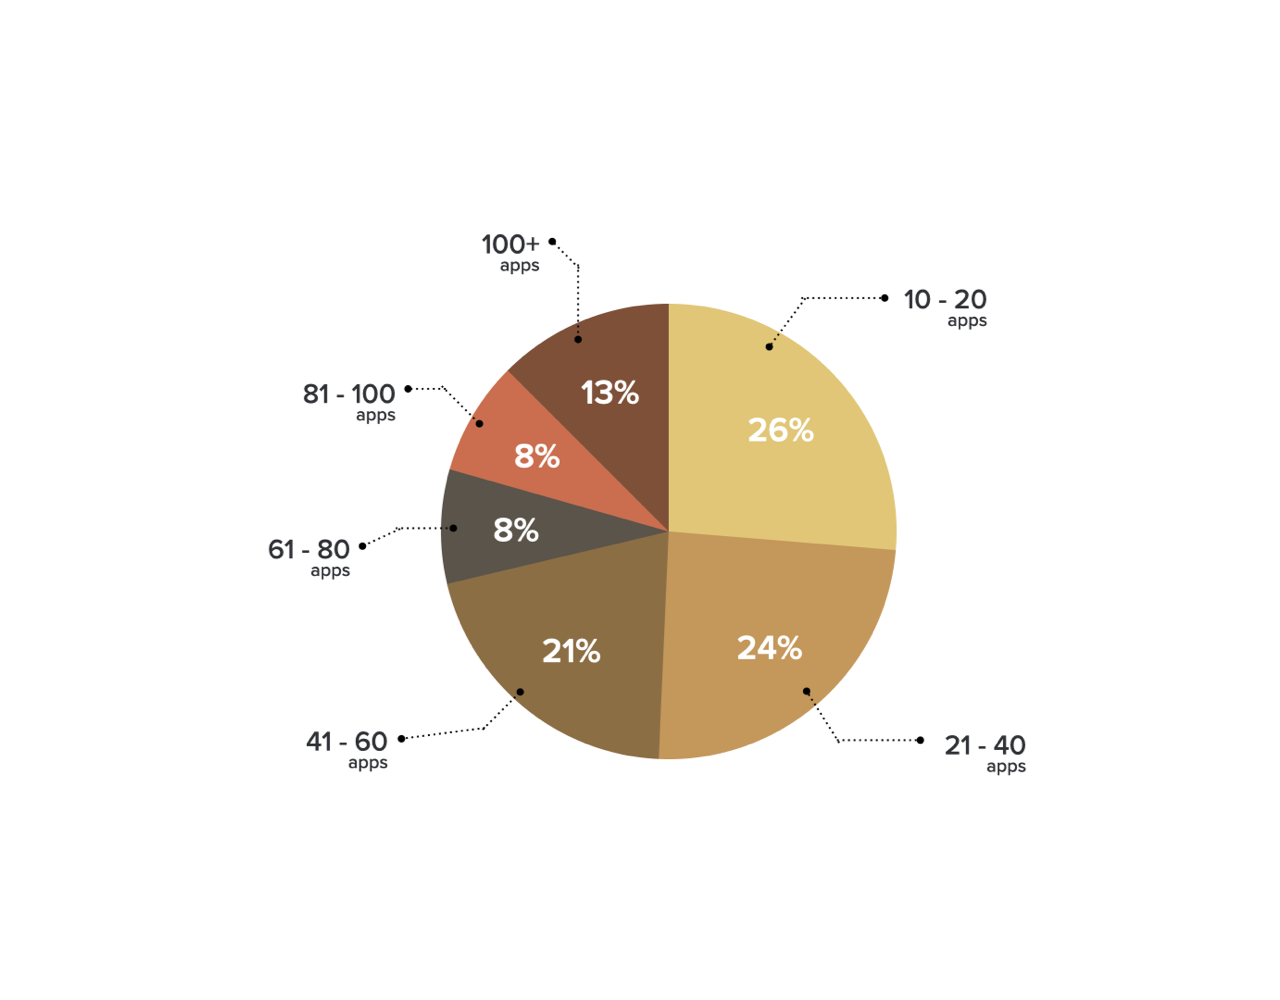
3rd party apps installed on the phone?
It’s an agency model which works in a shared studio. This option was out because there is hardly any collaboration with a cross-functional team.
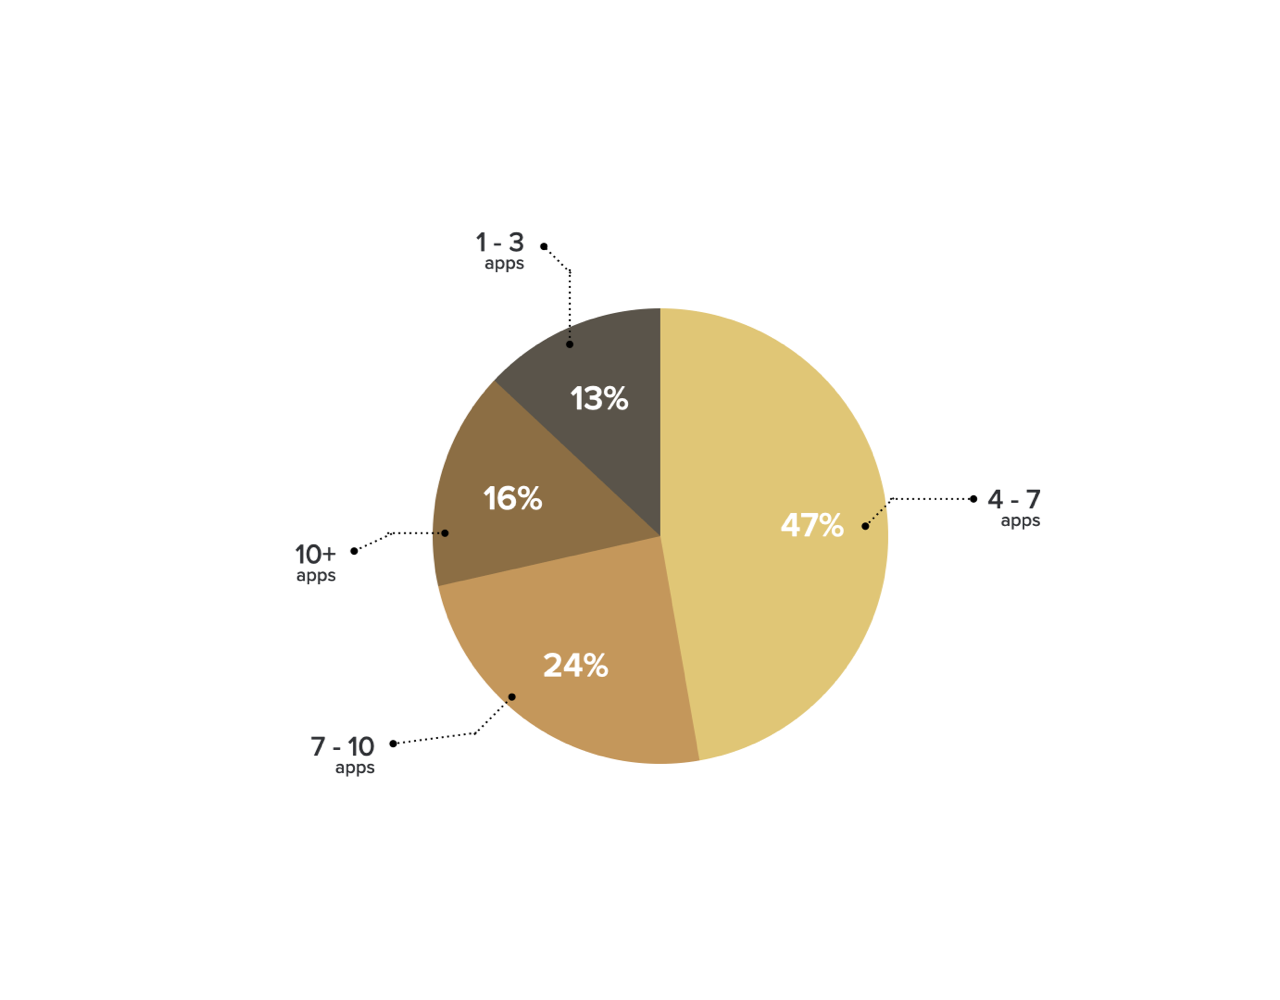
How many apps do people use daily?
Results show 4-7 apps people use every day which was a mix of communication, food, email, social etc.
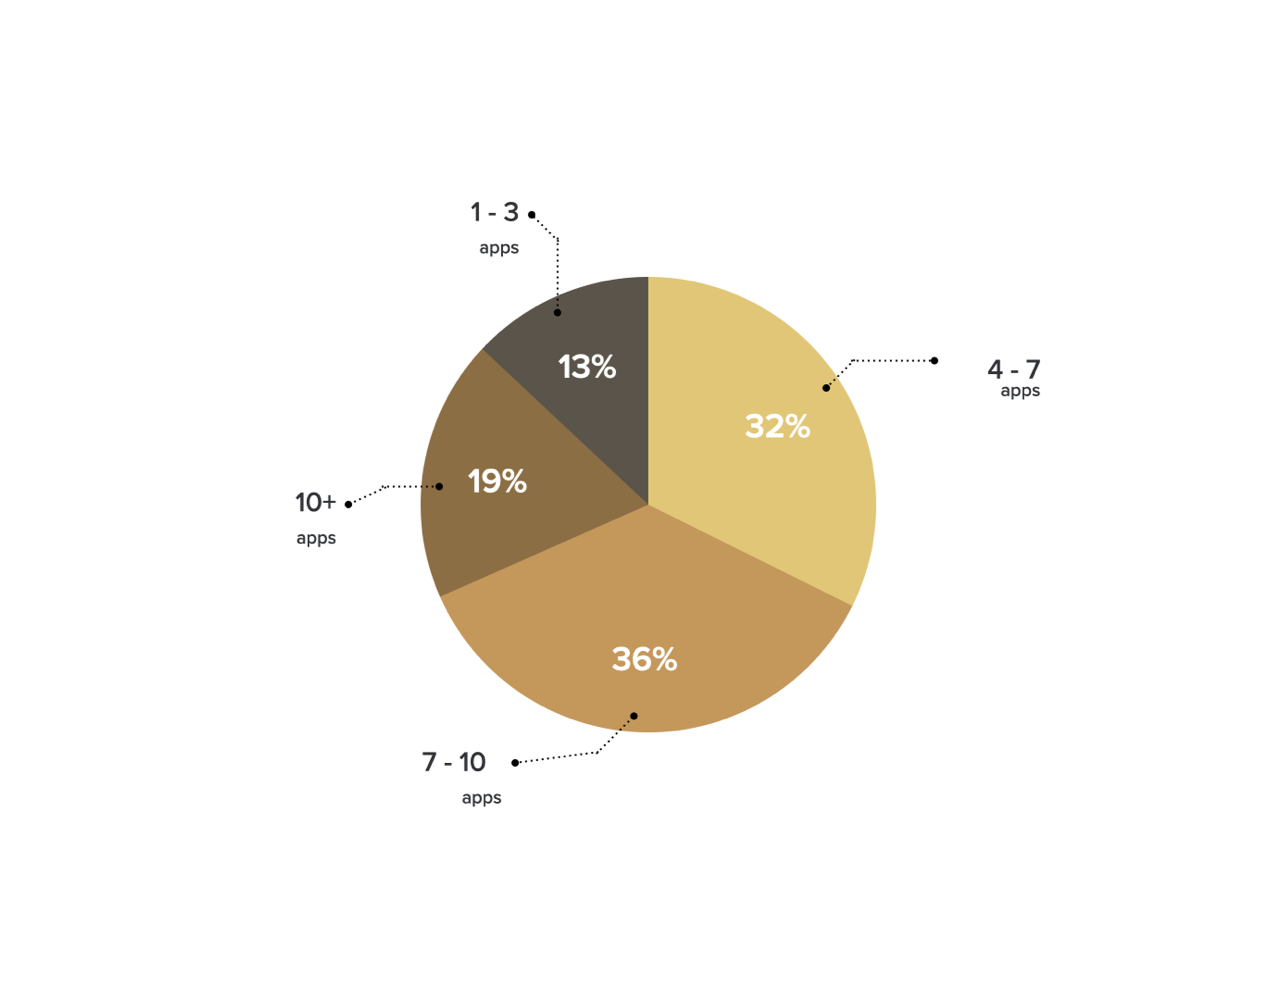
How many apps do people use once a week?
People use 4-7 apps which are mostly around banking, content-driven apps like Linkedin etc.
Excluding daily apps
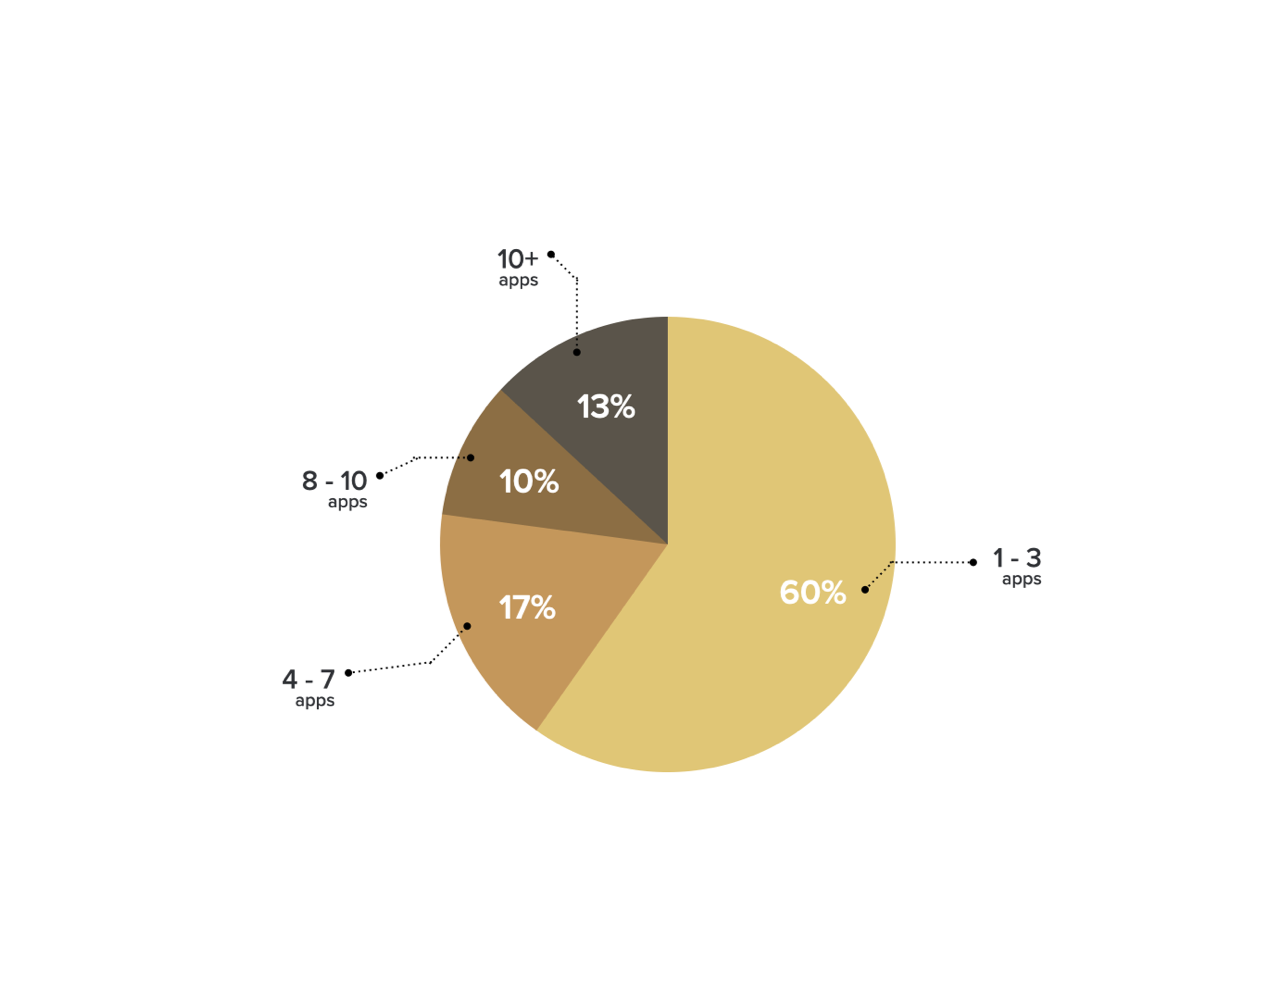
How many apps do people use once/twice in a month?
1 - 3 was a surprise. For some, it was the banking and for some, it's something related to 'passion' which they use in their free time. e.g. traveling
Excluding daily & weekly apps
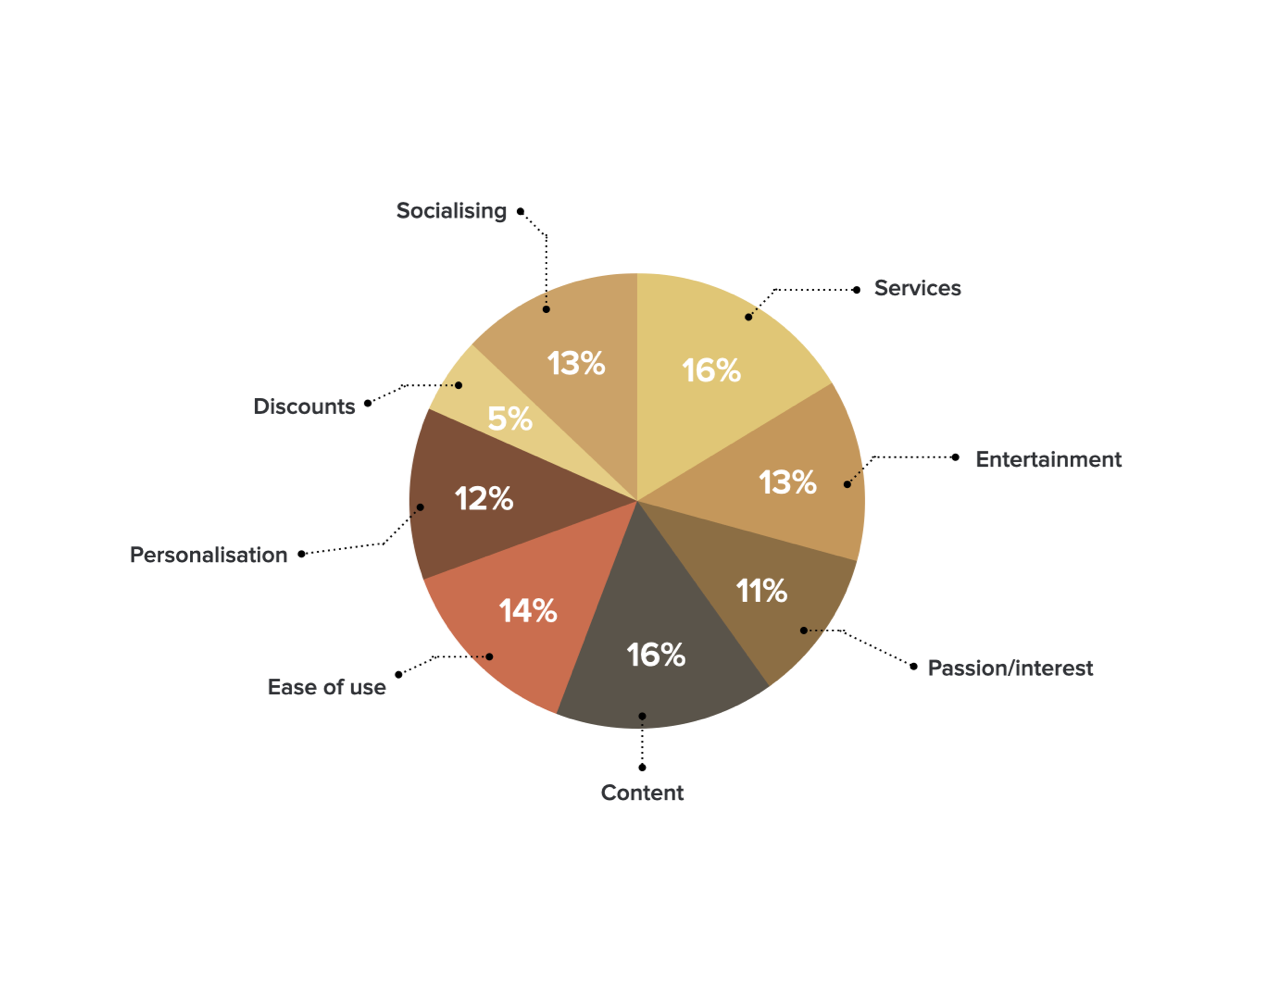
What motivates people to come back to the app?
Content (data) & services are key motivators.
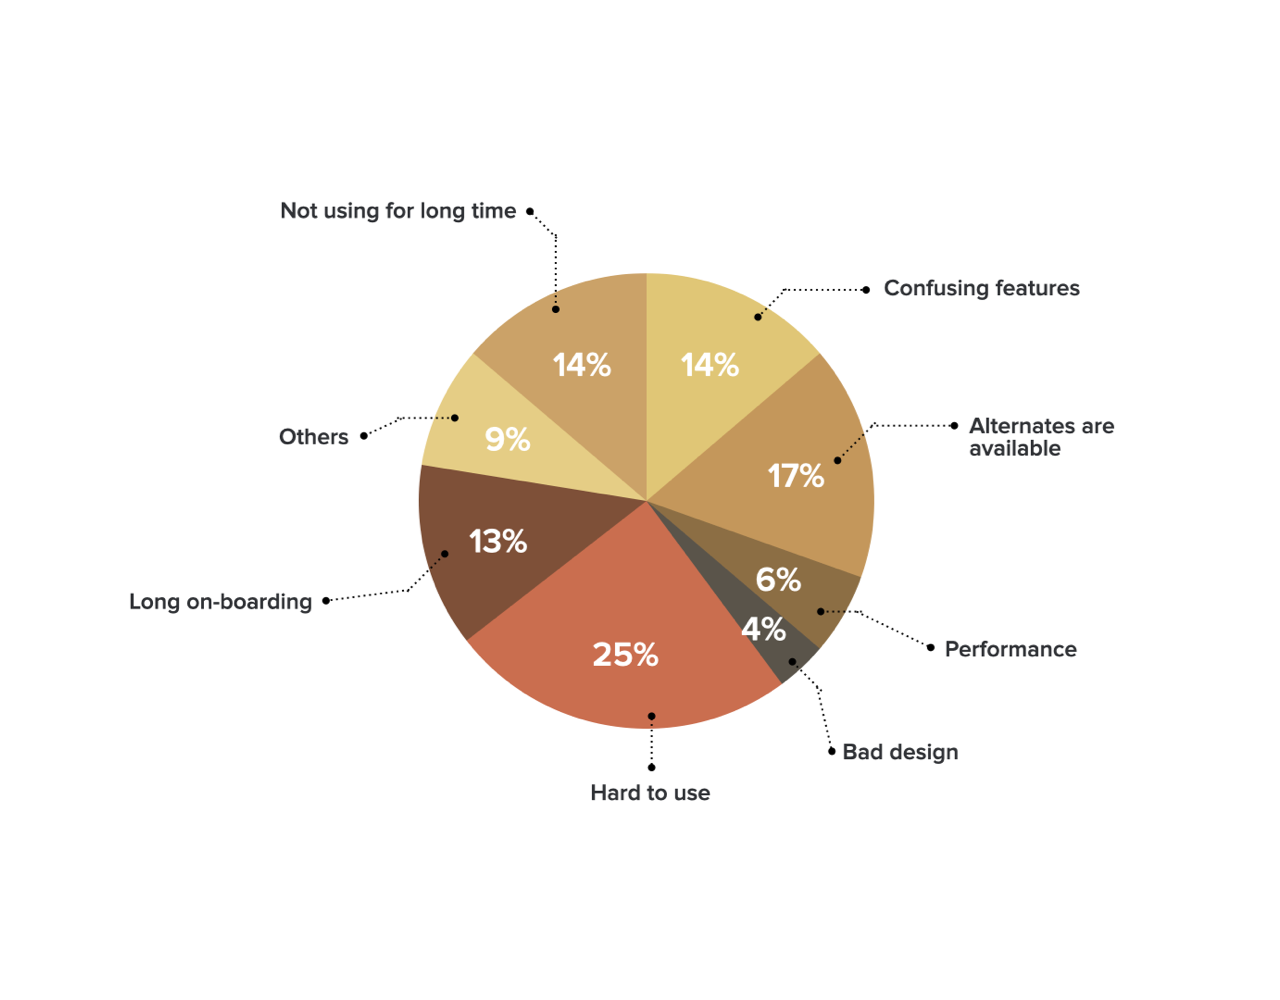
What triggers uninstall the app?
Performance, lousy usability & design are the key triggers for uninstalling.
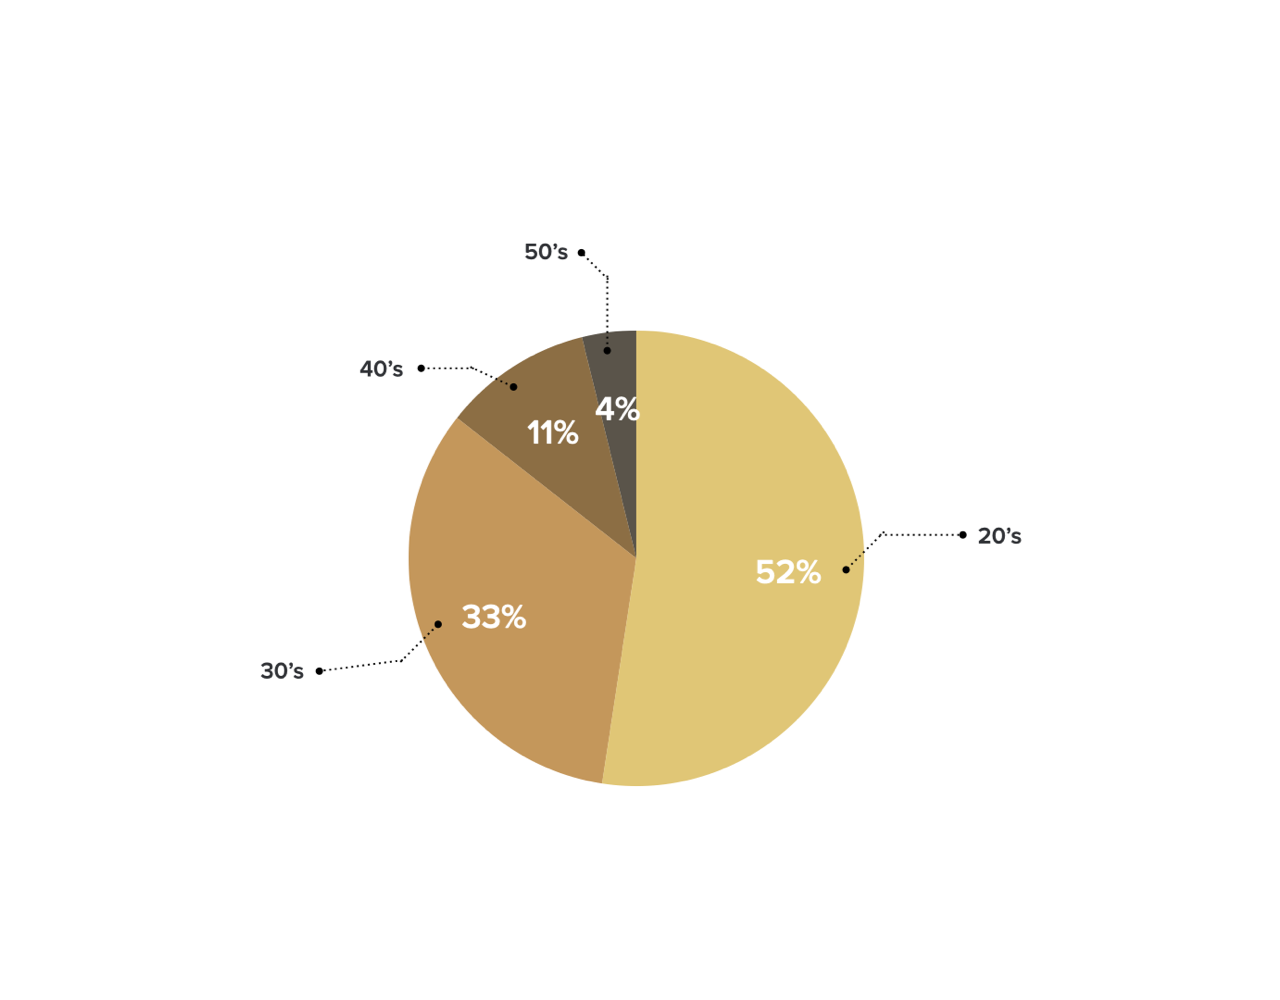
Age groups
Pesearch was performed on corporate employees. I'm planning to extend this to the non-power users soon.
Research synthesis - Four circles of app
Based on the results, I began to believe that there are four circles of apps on our phones, and every app fits in one of these. The circle is not a folder which we create on the phone but a virtual one based on your usage patterns.
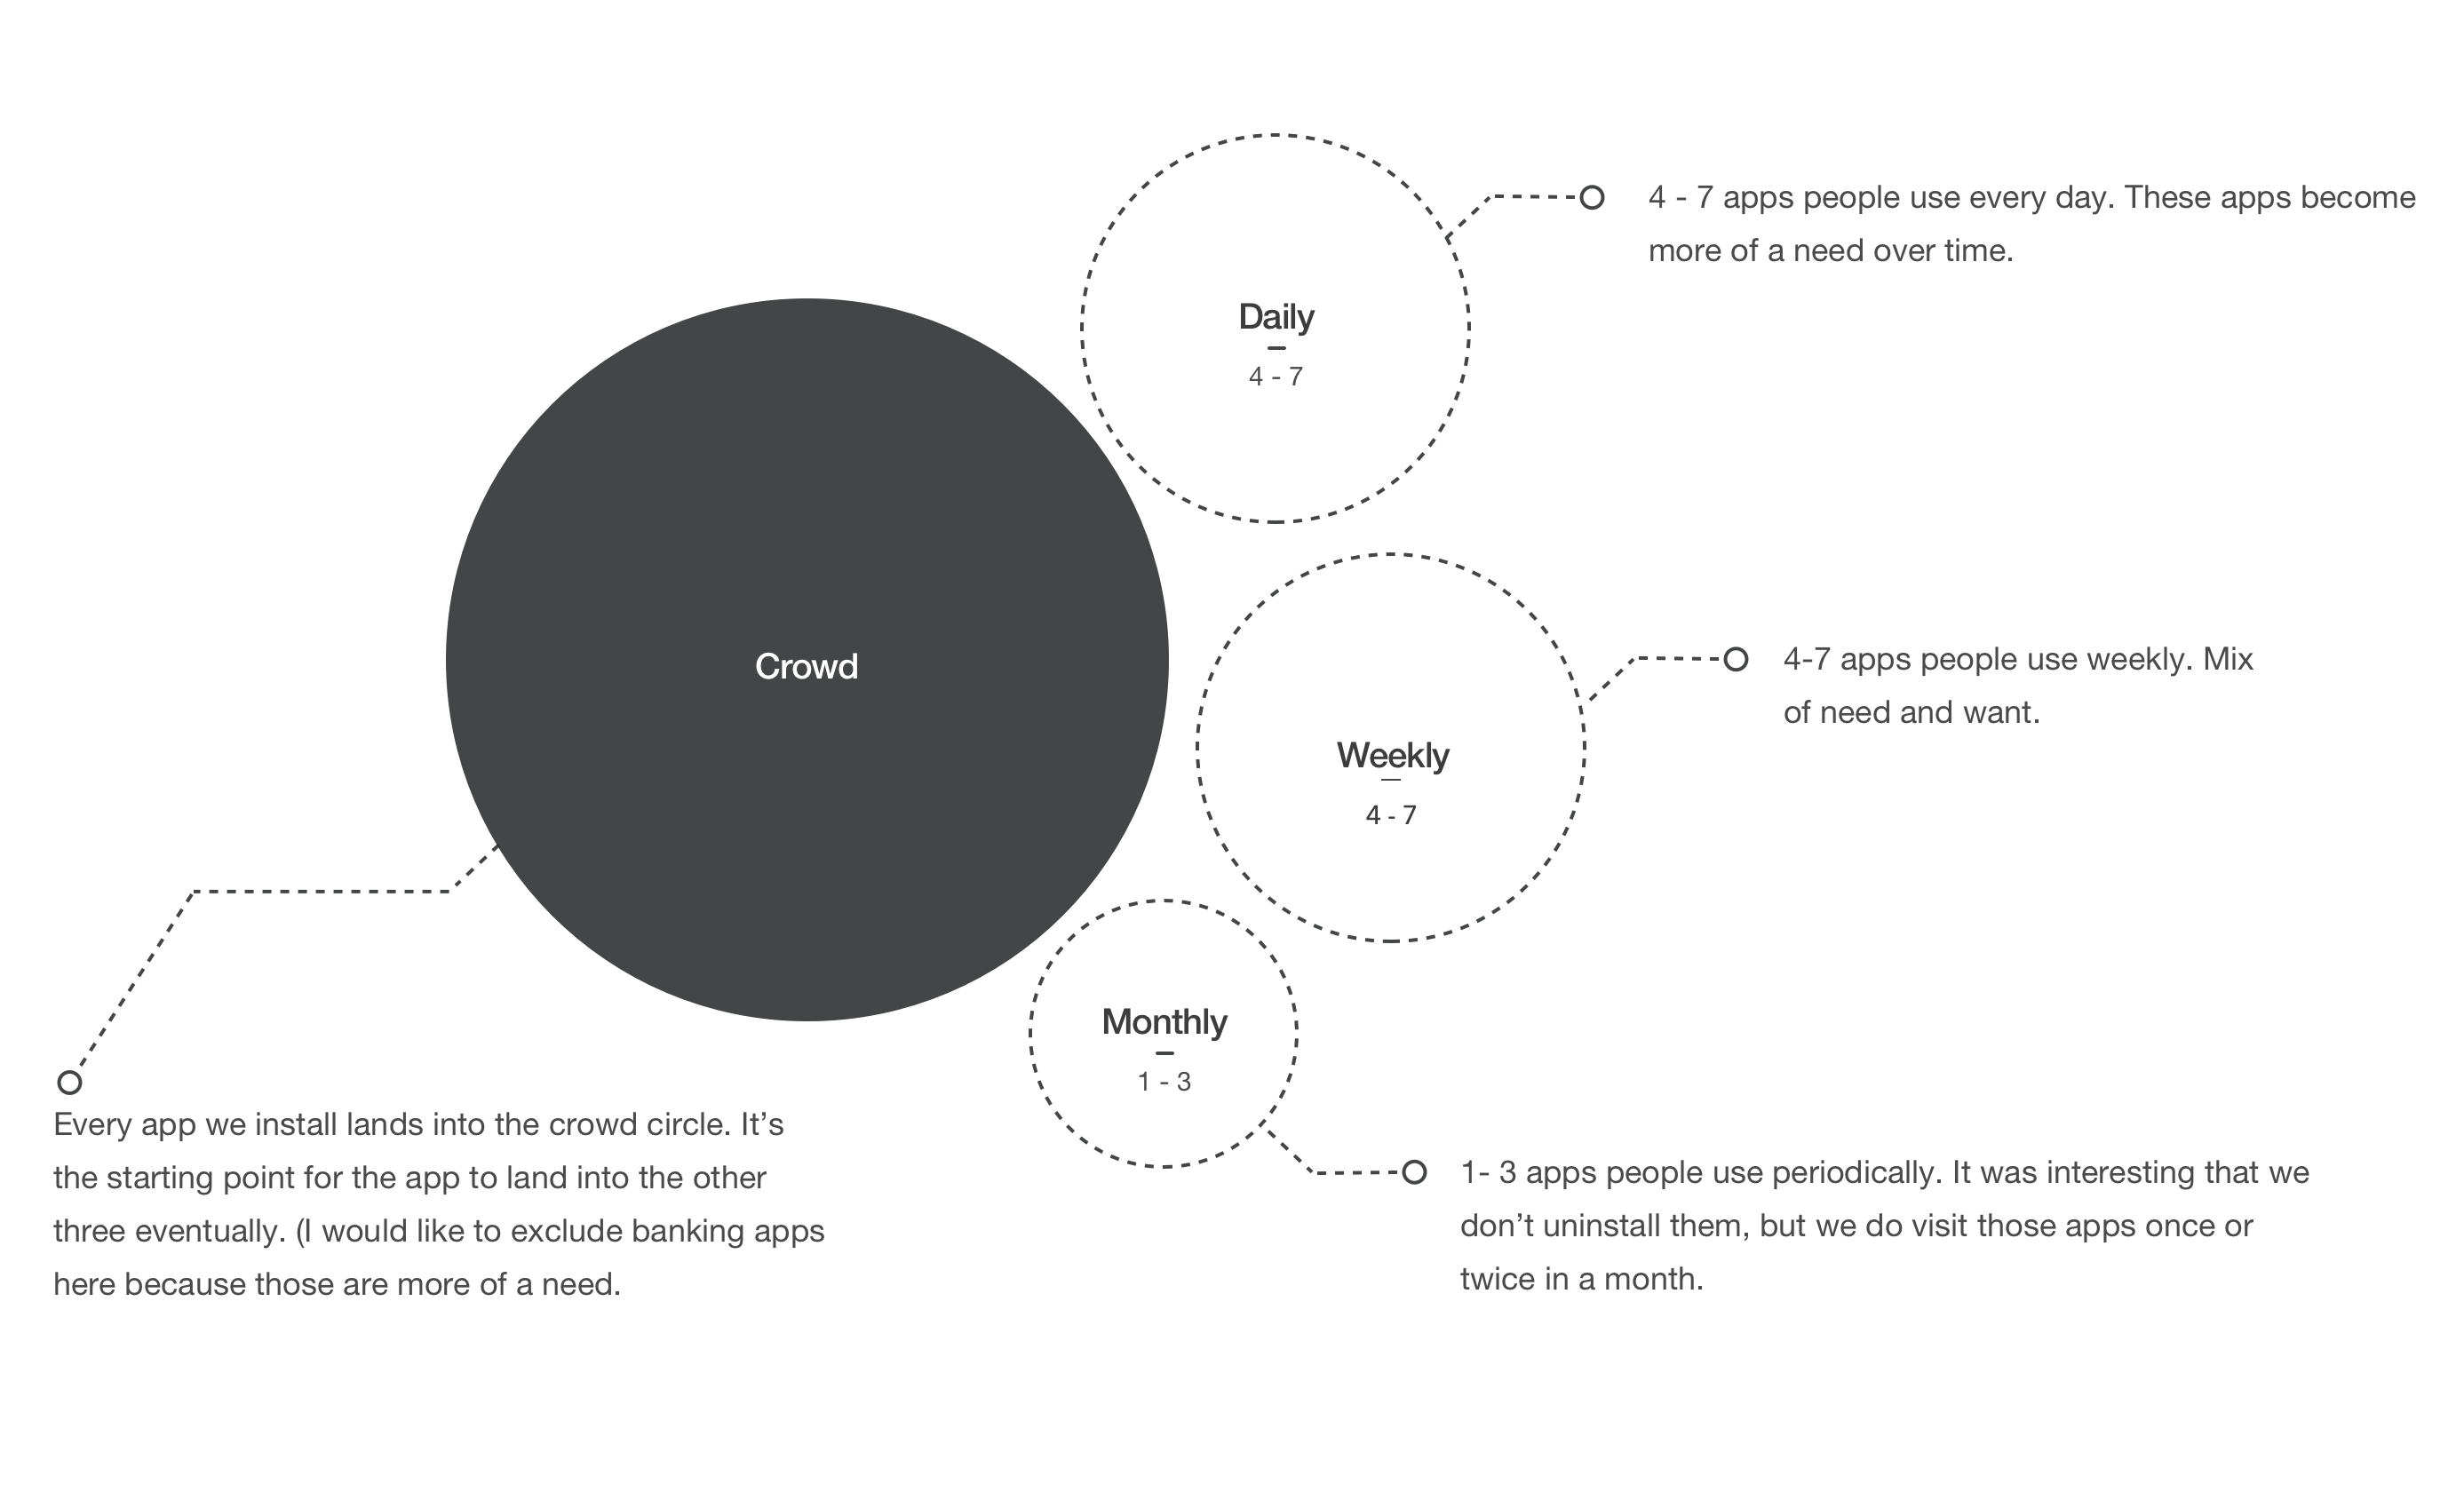
Research showed that daily and weekly apps were mostly needed for communication, food, finance, etc. Monthly was different; most of them were interest and passion-driven apps. These apps differ from social media apps like Facebook, Instagram, or Twitter.
Value of the app changes over time."
Note - I'm still working on this research. I'll be updating this page soon with the final findings and insights.